
From thousands of readings to a handful of decisions
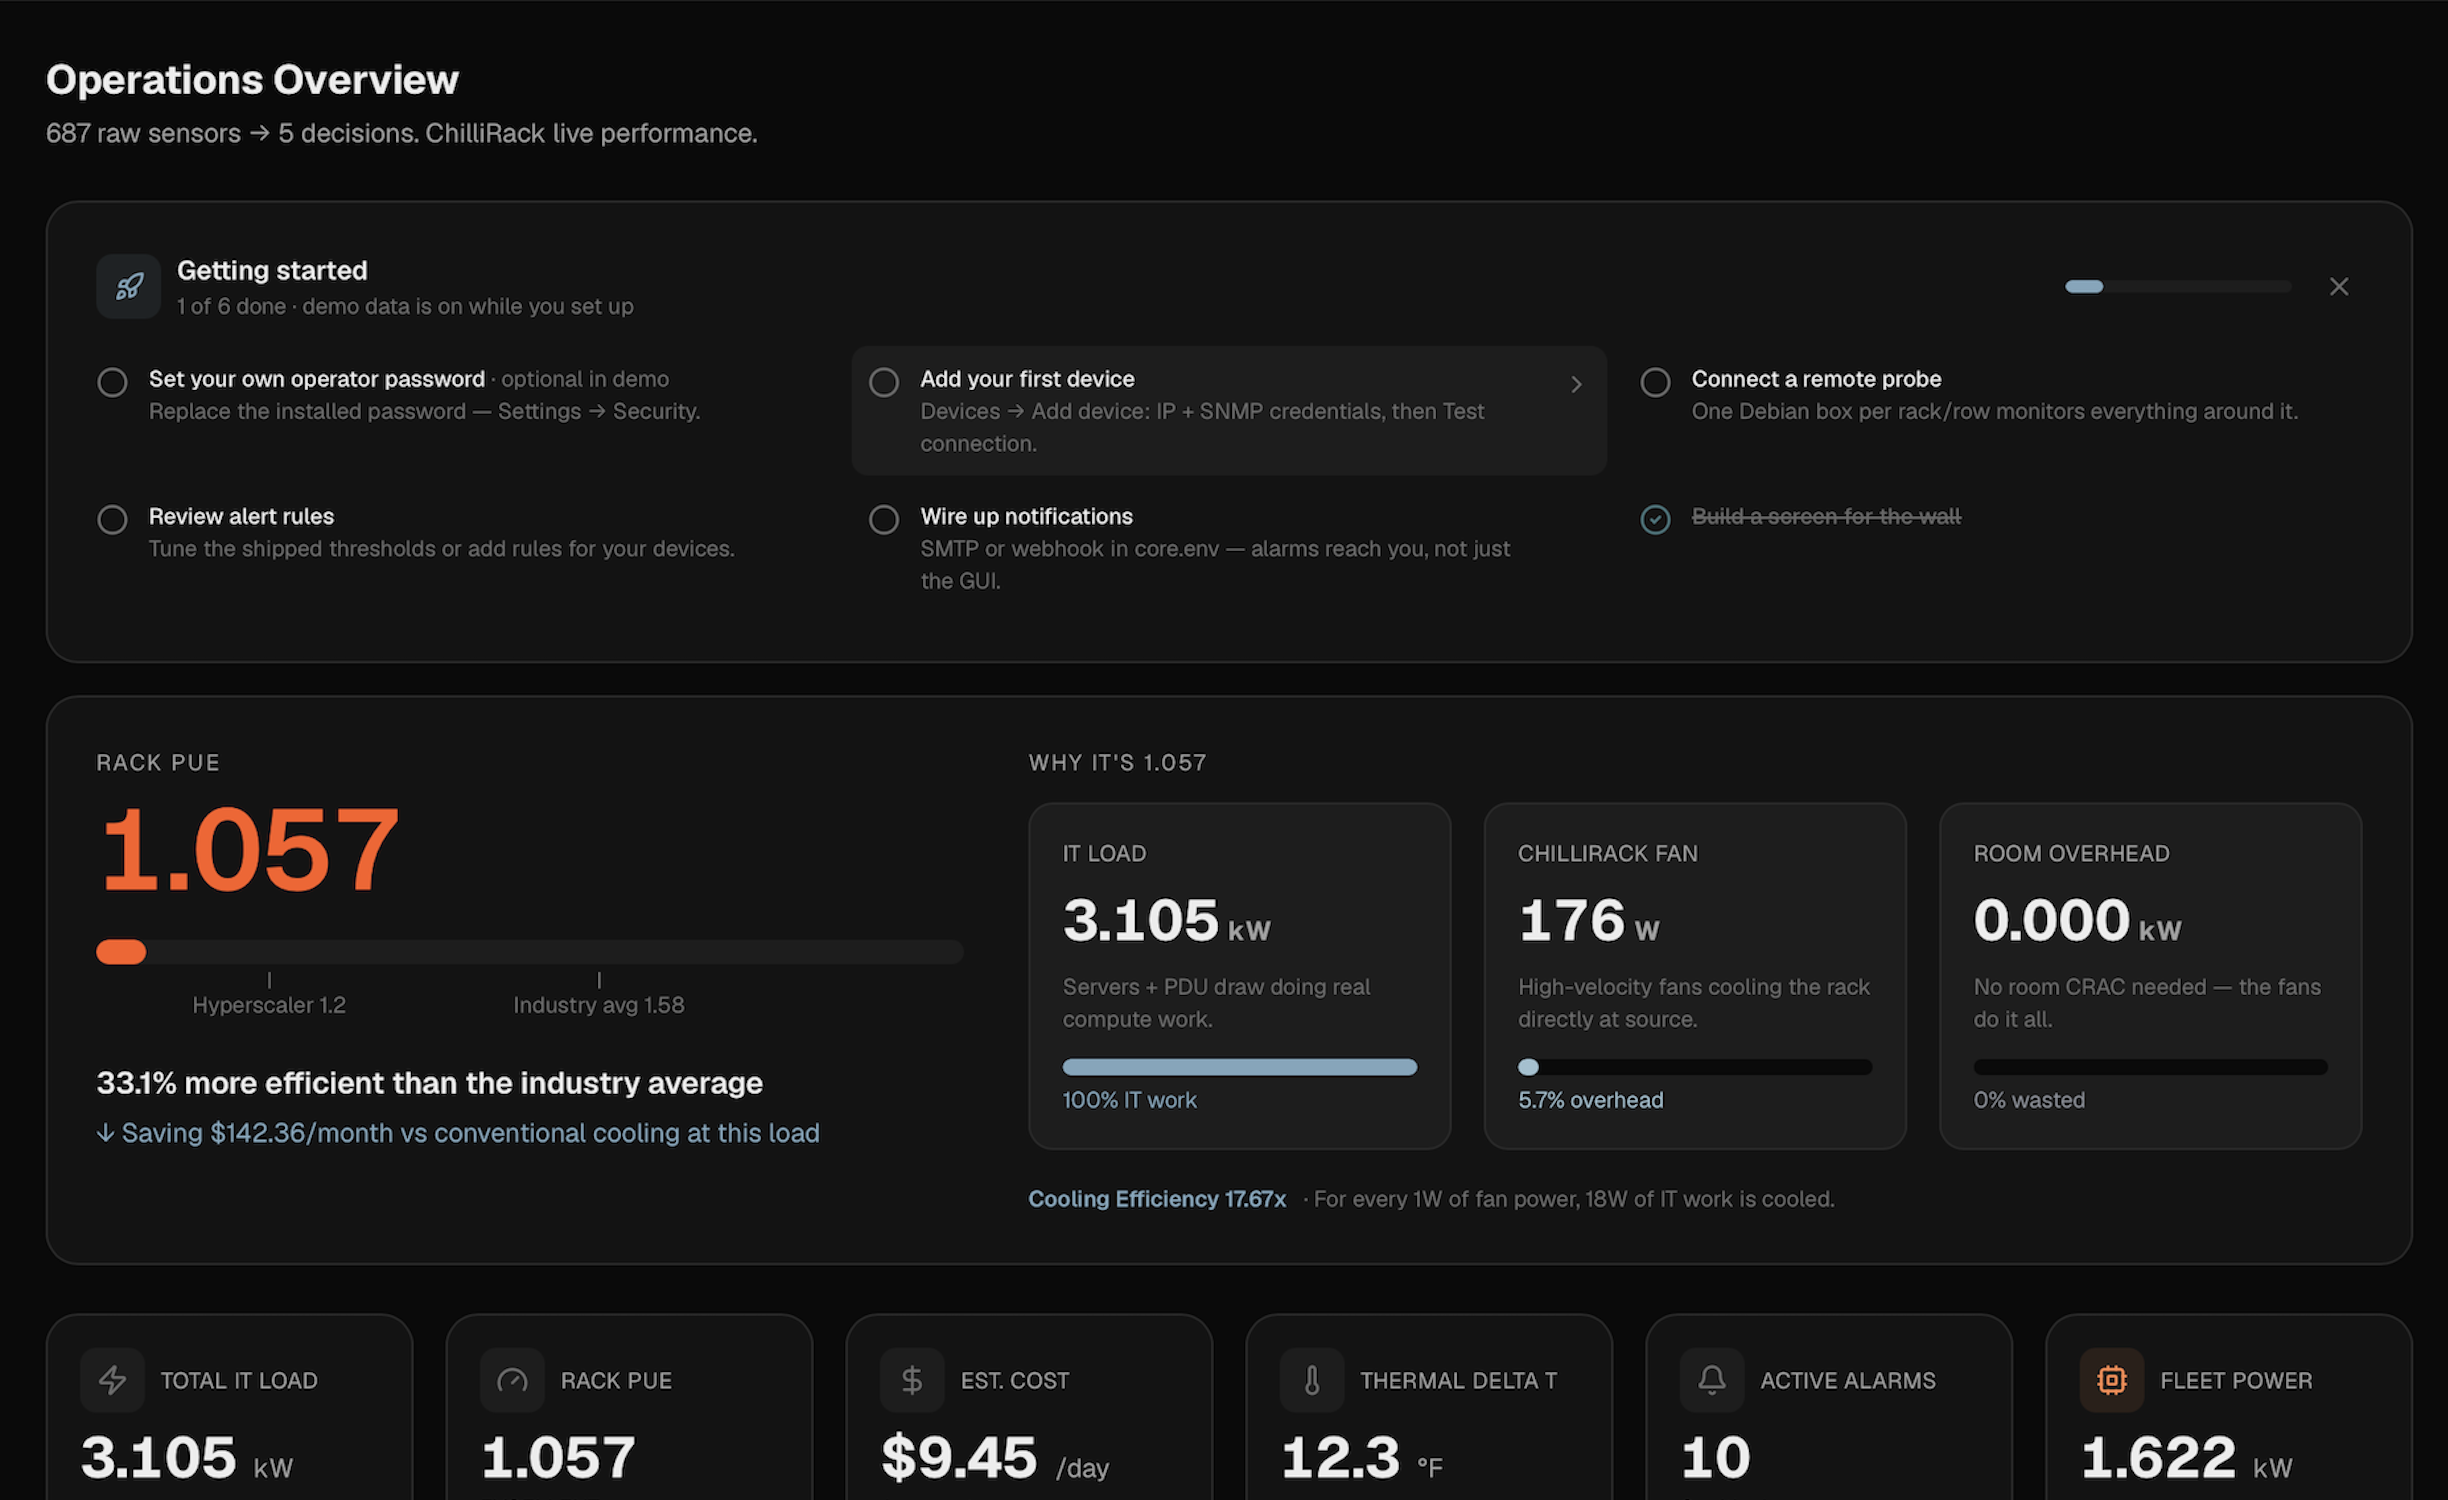
Every monitoring tool can collect metrics. Point it at enough devices and you will have more numbers than any person can read: interface counters, sensor readings, service checks, log lines, all ticking away in real time. Collection is solved. It has been for years.
The problem was never a shortage of data. It is that a wall of raw readings tells you almost nothing about what to do next. When something breaks at 2am, you do not need six hundred green rows and one red one buried among them. You need to know which rack is hot, which link just flapped, which service stopped answering, and whether any of it is related.
Status, not readings
Stratum is built to close that last gap. Live cards, charts, active alarms, topology, and wall views exist to turn many individual readings into operational status. The design goal is fast scanning during normal operations and quick investigation during an incident, so you move from “something is wrong” to “here is where” in seconds, not minutes.
Threshold rules do the watching so you do not have to. Set the limits that matter for the sensors you care about, and let alarms surface the crossings. Acknowledge and resolve them, so the team can separate known issues from genuinely new work instead of staring at an undifferentiated feed.
Where the signal comes from
Good decisions need more than one angle. Stratum pulls SNMP metrics from devices, collects syslog for link changes and firewall events, runs HTTP service checks, and tracks environmental and power sensors, then presents them together. Topology and map-style layouts add the relationships: which devices, links, rooms, and racks depend on each other. When an alarm fires, that context is what turns it into an action.
That is the whole point of the product. Not to show you everything, but to show you what needs attention, and where to look next.
Want to see it against your own gear? Try the Windows pre-release, or reach out.